There are often example datasets for various purposes but they are not comparable to real world data because they are clean and they contain no errors.
Instead, we'll settle for some simple statistics on top of time series obtained by yahoo finance. My tool of choice is clojure and incanter here and by the end of this post you will understand why (hopefully, cause otherwise I did a bad job).
You can find the complete repository here
I'll create a new project called finstats which will allow for a quick analysis of some stock available on yahoo finance
lein new finstatsFirst, we need to fetch the data from yahoo with something like this We need to create the following file in src/yahoo.clj as given in Let's make finstats.yahoo accessible by modifying the first two lines of core.clj to
(ns finstats.core
  (:require [finstats.yahoo :as y]))
finstats.core> (y/create-http-request "SIE.DE" [2012 1 1] [2013 1 1])
"http://ichart.finance.yahoo.com/table.csv?g=d&ignore=.csv&s=SIE.DE&c=2012&b=1&a=1&f=2013&e=1&d=1"
finstats.core> (def raw-data (slurp (y/create-http-request "SIE.DE" [2012 1 1] [2013 1 1])))
Of course, we can't do a whole lot with a big string, so we need to parse it.
There are nice libraries but it's so easy, we might as well just do it on our own: Add the following function to finstats.yahoo
(defn parse-string
  [s]
  {:pre [(string? s)]}
  (->> (str/split-lines s) ;; splits by newline
       rest ;; drops the first line (the header)
       (map #(str/split % #",")) ;; splits each line by comma
       (map #(cons (first %) (map read-string (rest %)))) ;; parses each element of the row except the first
       (mapv #(zipmap [:date :open :high :low :close :volume :adjusted-close] %)))

  )
finstats.core> (y/parse-string raw-data)
[{:adjusted-close 72.5961, :volume 2979000, :close 77.4255, :low 77.1348, :high 78.5883, :open 78.4042, :date "2013-02-01"} {:adjusted-close 73.4501, :volume 233990 ...
Let's save the result in variable ohlcs (open-high-low-close with a plural s at the end) with
finstats.core> (def ohlcs (y/parse-string raw-data))
#'finstats.core/ohlcs
finstats.core> (first ohlcs)
{:adjusted-close 63.9867, :volume 4775100, :close 70.8652, :low 69.4504, :high 71.5725, :open 69.6054, :date "2012-02-01"}
finstats.core> (get-in ohlcs [100 :volume])
2163600
Note that at this point we have full access to the EOD API of yahoo with a mere 23 lines of code.
To finish the post, I just want to have a nice bar chart that I can use to marvel at price development of Siemens. For this purpose, include the line
[incanter/incanter "1.5.5"]
(ns finstats.core
  (:require [finstats.yahoo :as y]
            [incanter.charts :as charts]
            [incanter.core :as ic]))
Now you can run
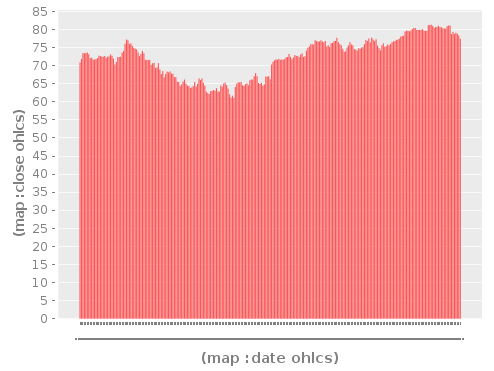
finstats.core> (ic/view (charts/bar-chart (map :date ohlcs) (map :close ohlcs)))
Note that yahoo returned the data the otherway round, so this chart must be read from right to left. A (def ohlcs (vec (rseq ohlcs))) will help here.
The end result should look like this:
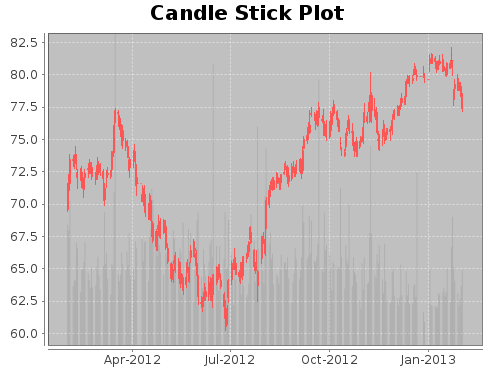
(defn- create-dataset
  "creates an incanter dataset from ohlc data"
  [rows]
  {:pre [(every? map? rows)]}
  (let [ks (keys (first rows))]
    (ic/dataset ks
                (map (apply juxt ks) rows))))
(ic/view (charts/candle-stick-plot :data (create-dataset ohlcs)))
No comments :
Post a Comment